


Understanding the Hospital Sector (Part 5): KPIs - ARPOB & ALOS

As we explored in Part 4, the hospital sector is undergoing transformation, driven by new models and intensifying competition. But while innovation reshapes the landscape, success in the hospital industry still hinges on the ability to measure, monitor, and optimize key performance indicators (KPIs) now let’s wear the lens on an analyst.
In this fifth installment, we take a closer look at two critical KPIs: Average Revenue Per Occupied Bed (ARPOB) and Average Length of Stay (ALOS). These metrics reveal more than just numbers—they tell the story of operational efficiency, patient care quality, and financial performance. By understanding how these indicators interplay, hospitals can fine-tune their strategies to deliver better outcomes for both patients and stakeholders.
KPI #1 — ARPOB: The Heart of Hospital Financial Health
In the world of hospital business, one metric stands out as a critical indicator of operational efficiency, profitability, and overall performance: Average Revenue Per Operating Bed (ARPOB). In an industry characterized by high capital expenditures, long gestation periods, and complex operations, ARPOB serves as a compass for understanding a hospital's financial health and its ability to generate revenue relative to its capacity.
What is ARPOB?
Simply put, ARPOB measures the average revenue generated per bed per day by a hospital. It helps investors, analysts, and hospital managers assess how effectively a hospital is utilizing its infrastructure (i.e., its beds) to generate income.
How this ARPOB is calculated?

For example, if a hospital generates ₹10 crore in revenue over a quarter (90 days) with 100 operating beds, the ARPOB for that period would be:

Breaking Down ARPOB’s Drivers: Service Mix, Pricing Strategy, and More
1. Specialization and High-Margin Services
Specialization is a key factor influencing ARPOB. Specialized hospitals that focus on high-margin services such as oncology, cardiology, or neurosurgery often have higher ARPOB compared to general hospitals. These services not only attract patients who are willing to pay a premium but also tend to require fewer beds to achieve higher revenues. Cancer Institutes in India have a higher ARPOB due to the high cost of cancer treatments, which often require long hospital stays and advanced therapies. According to industry reports, oncology treatments can generate upwards of ₹50,000–₹1,00,000 per patient for a week, compared to the ₹20,000–₹30,000 for general hospital stays. This directly boosts ARPOB in specialized hospitals.

For instance, Rainbow children’s Medicare which is specialized in children’s and mother care has an ARPOB of INR ~55,000 with ALOS of less than 3 days as against a multispecialty hospital like KIMS which has INR ~35,000, with ALOS of more than 4 days.
In India, where a massive proportion of healthcare spend is driven by out-of-pocket payments, specialized hospitals can attract affluent, high-paying patients, making ARPOB a critical driver of profitability. Hospitals that can combine specialization with premium services, such as private rooms, luxury suites, and personalized care can see a multiplier effect on ARPOB.
2. Pricing Strategy and Tiered Services
Hospitals that employ a tiered pricing strategy—offering varying levels of services (e.g., deluxe rooms vs. standard rooms, specialized care options)—tend to increase ARPOB. This strategy helps hospitals tap into different market segments and generate more revenue per patient, optimizing both capacity utilization and service offerings. Higher ARPOB typically indicates that a hospital is effectively utilizing its available capacity. It suggests that the hospital is either providing higher-margin services or maintaining a consistent flow of patients, which leads to better revenue generation per bed. In simpler terms, a higher ARPOB means the hospital is making the most out of its resources, whether by offering specialized, high-demand treatments or ensuring that its beds are rarely empty (value/volume).
Hospitals like Fortis Healthcare, Apollo Hospital implement such pricing strategies. Apollo Hospitals offers a mix of services: standard care for lower-income patients through public health schemes, and luxury care (with premium pricing) for private patients. This allows them to increase ARPOB while keeping a balanced volume of patients. It offers premium services in metro areas while also catering to more budget-conscious patients through its network of multi-specialty hospitals. As a result, they can maintain a healthy ARPOB across different types of patients (its ARPOB ranges from 55,000 to 92,000 in Metros and in Non-metros 30,000 to 50,000).
The ability to provide multiple pricing tiers also creates a more resilient revenue stream for hospitals. Even as government schemes like Ayushman Bharat bring in volume through lower-priced services, the high-margin private patients and specialty treatments help offset the lower revenue from subsidized treatments, keeping ARPOB optimized.
3. Government Regulations and Policy Impact
In countries like India, where government schemes such as Ayushman Bharat require hospitals to treat a large percentage of low-income patients at discounted rates, ARPOB can be significantly impacted. While the increase in patient volume may seem attractive, the reduction in treatment prices can lower ARPOB, particularly for private hospitals. Hospitals must be adept at creating an integrated pricing strategy that incorporates both government scheme patients and private-paying patients. The right mix is crucial for maintaining ARPOB without sacrificing patient volume.
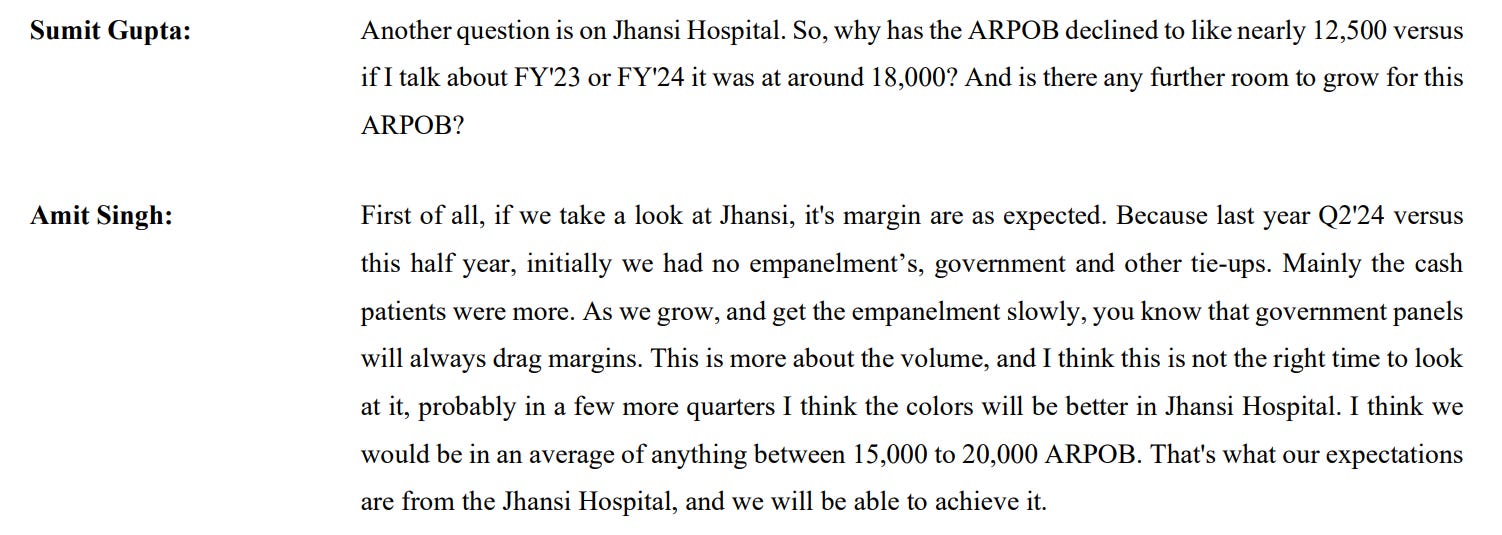
Take Yatharth Hospital, for instance. It has seen a significant increase in patient volumes due to government initiatives like Ayushman Bharat, but this has resulted in lower ARPOB from government-subsidized patients. To mitigate this, Yatharth has focused on increasing revenue from private-pay patients through improving case mix (this is how ARPOB also tells you about the changes in case mix), which has allowed the hospital chain to maintain a healthy ARPOB. Its Noida hospital has achieved 91% occupancy in Q4FY23 with ARPOB of INR ~25,000 in which the government business contribution was ~35% in that quarter. In the Q2FY25 government contribution decreased which has led to fall in occupancy to 83% however, this resulted in an increase in ARPOB to around INR 29,000, reflecting a 16% rise. On the other hand, the Noida Extension unit has an ARPOB of about INR 38,000 with a 60% occupancy rate, where the government business contribution is the lowest among the units.
4. Operational Optimization: Beyond service offerings, ARPOB reflects how well a hospital can optimize its operations. For example, how quickly can a hospital turn over beds between patients? Is there a backlog? Does the hospital efficiently balance inpatient and outpatient services?
For instance, Narayana Hrudayalaya operates on a high-volume model, performing a large number of surgeries daily. This scale allows the hospital to spread fixed costs over a greater number of patients, effectively lowering the cost per surgery. For example, they perform more than 50 cardiac surgeries per day at their Bangalore campus, which is far more than most hospitals in India. The hospital employs assembly line concepts in its surgical procedures, allowing for faster turnaround times and increased efficiency in the operating rooms. This model ensures that surgeons can perform multiple surgeries in a day, enhancing productivity. Staff members are utilized according to their qualifications, allowing surgeons to focus solely on surgical tasks while other trained personnel handle preoperative preparations and patient education. This maximizes the efficiency of the surgical process which leads to higher revenue per bed.
5. Occupancy Rate and Bed Utilization
ARPOB is also closely tied to bed occupancy rates. Hospitals with high occupancy rates (i.e., a large percentage of beds are filled) typically have higher ARPOB. A hospital that can efficiently turn over its beds and maintain a high patient-to-bed ratio increases the revenue it generates per bed.
For example, Max Healthcare maintain occupancy rates of around 70-75%, which directly enhances their ARPOB by ensuring their beds are in high demand and efficiently utilized.
Hospitals that can quickly turn over beds while maintaining quality care can see their ARPOB rise significantly. This is why hospitals in highly competitive regions, like Bangalore or Chennai, often see higher ARPOB due to better bed utilization rates compared to those in less competitive areas.
6. Hospital Location and Market Demographics
Location plays a critical role in determining ARPOB. Metro cities with a high concentration of affluent patients and a robust demand for specialized healthcare services tend to have higher ARPOB than hospitals in rural or semi-urban areas.
For example, hospitals in Mumbai or Delhi NCR, such as Jupiter Lifeline Hospitals or Max Healthcare, often report higher ARPOB due to the ability to charge higher prices for high-demand services.
On the flip side, hospitals in Tier-2 or Tier-3 cities might face pricing pressure, even for specialized services, but they compensate through volume. For instance, KIMS or Yatharth hospital, which operates primarily in smaller cities, focuses on high-volume, low-cost cardiac surgeries and keeps its ARPOB low but highly consistent due to patient volume. ARPOB by ensuring their beds are in high demand and efficiently utilized.
7. Case Mix & Profitability Pressure
The case mix—the types of patients and treatments a hospital deals with—can have a significant impact on ARPOB. If the case mix doesn’t improve (i.e., if the hospital is primarily treating lower-revenue patients or basic procedures), it can create downward pressure on ARPOB. The ideal scenario is for hospitals to improve the quality of their case mix by attracting more specialized and high-margin cases like cardiology, oncology, or advanced surgeries. But if the case mix deteriorates (e.g., the hospital begins to treat more basic, low-margin cases), ARPOB will likely drop, affecting overall profitability.

8. Doctor Attrition and Its Impact
Doctor attrition, especially of star doctors who bring in a significant patient base, can drastically impact hospital revenues. Doctors, especially renowned specialists, play a massive role in patient retention and bringing in premium patients. When a hospital loses a star doctor, patients who came specifically for that doctor often follow the doctor to their new facility. This can cause a drop in occupancy and ARPOB.
Take the example of a prominent hospital like HCG. Suppose one of their top oncologists leaves and starts a practice in a nearby location. The patients who relied on that doctor for their treatments might now migrate to the new center. The hospital would then face reduced occupancy rates in its oncology departments and a deterioration in ARPOB.
This dynamic is even more pronounced in highly competitive cities where hospitals are fighting for the same affluent patient pool. The loss of a doctor could be disastrous for a hospital's bottom line if not managed properly.
9. Supply and Demand Dynamics in Regional Markets
Supply growth in regional markets can have both positive and negative consequences on ARPOB. If new hospitals flood the market, it can lead to oversupply, which dilutes pricing power. However, if demand continues to rise without a corresponding increase in supply, pricing power and ARPOB can actually improve.
Consider the example of Kovai Medical Center & Hospital in Coimbatore. As regional healthcare demand increased, Kovai's expansion allowed it to capture a larger market share, increasing its ARPOB by providing specialized treatments and attracting patients from neighboring towns. But in other markets, if the number of hospitals expands too rapidly, ARPOB could fall due to price competition.
Case in point — Rainbow children’s Medicare: Leveraging Specialization to Boost ARPOB
Rainbow children’s Medicare, a leader in India’s Pediatrics market, has consistently reported strong ARPOB figures due to its focused approach on children’s and mother care. Rainbows ARPOB was around ₹55,000 which significantly higher than the industry average.
Approximately 70% of Rainbow’s revenue comes from pediatric services, particularly high-risk pregnancies and complex surgeries such as pediatric cardiac and neurosurgery. A child needs 40% more concentrated and specialized care than an adult. This specialization allows the hospital to command higher prices due to relatively less competition in these areas, contributing to increased ARPOB. The focus on specialized pediatric care leads to better realization per patient, as these services typically have higher reimbursement rates.
About 33% of Rainbow's beds are allocated to Neonatal Intensive Care Units (NICU) and Pediatric Intensive Care Units (PICU), which generally yield higher revenues compared to standard inpatient beds. This strategic allocation supports a higher ARPOB. Also, it has a favorable payer mix, with approximately 48% of its revenue coming from cash payments and 52% from insurance. Government regulation in pediatrics is less as compared to other treatments hence Rainbow can implement price hikes more easily.
To sum it up……
ARPOB is not just about the beds in a hospital; it’s a direct reflection of how well a hospital is utilizing its infrastructure, pricing its services, and managing patient flows. Hospitals with high ARPOB are typically those that specialize, optimize their service mix, cater to premium patient segments, and find ways to balance government schemes with private payers.
For investors, ARPOB serves as a powerful metric to gauge operational efficiency and profitability. While a high ARPOB is an indicator of a well-utilized hospital, the key is not just to aim for a high ARPOB but to understand the drivers behind it—be it specialization, patient volume, pricing strategy, or bed utilization. The ability to fine-tune these levers will ultimately determine the success of a hospital in an increasingly competitive and complex healthcare market.
In India, where healthcare demand is rapidly growing, but supply is still catching up, focusing on ARPOB gives investors a clear view of how hospitals are managing to capitalize on this demand. Those that can successfully scale their operations, offer high-margin services, and optimize their bed utilization are well-positioned to lead in a market that continues to expand at a rapid pace.
KPI #2 — ALOS: The Invisible Lever in Hospital Operations
In the complex systems of hospital operations, some metrics appear front and center, like occupancy rates or revenue per bed. Others, like Average Length of Stay (ALOS), operate more silently, influencing every aspect of a hospital's efficiency, patient outcomes, and financial performance. ALOS, the average number of days a patient spends in the hospital from admission to discharge, is a deceptively simple metric. However, dig deeper, and it reveals a treasure trove of insights into operational efficiency and market positioning.
What Is ALOS, and Why Does It Matter?
At first glance, ALOS seems straightforward—shorter stays mean higher patient turnover, right? While partially true, ALOS impacts much more than just patient flow.
Revenue Per Bed: A shorter ALOS increases the number of patients a hospital can admit over a period, maximizing revenue per bed.
Cost Efficiency: Long stays increase costs for everything from staff to utilities, impacting profit margins.
Patient Outcomes: ALOS is often seen as a proxy for care quality. Shorter stays, coupled with low readmission rates, signify effective and efficient treatment.
Capacity Management: With fixed infrastructure, ALOS directly affects how well a hospital utilizes its beds and staff resources.
In short, managing ALOS well means striking the perfect balance between efficiency and care quality.
"Efficiency in healthcare is not about cutting corners; it’s about delivering the best outcomes in the shortest possible time" — Dr. Devi Shetty, founder of NH
How Is ALOS Calculated?
The formula is simple:
ALOS = Total Patient Days ÷ Total Number of Admissions
For instance, if a hospital has 10,000 patient days over a year and 2,000 admissions, its ALOS is 5 days.
What impacts ALOS?
1. Specialization Drives ALOS
Different types of hospitals have inherently different ALOS metrics:
Tertiary Care Hospitals: Focused on complex treatments (e.g., cancer, organ transplants), these hospitals naturally have a higher ALOS, often 5+ days.
Secondary Care Hospitals: Handling routine surgeries and treatments, ALOS here ranges from 3–5 days.
Daycare Facilities: Specializing in same-day procedures, their ALOS is below 1.
2. Technology's Role
Advances in technology have a profound impact on ALOS. For example:
Robotic surgeries for knee replacements have reduced recovery times from 5–7 days to just 3–4 days.
Telemedicine allows post-surgical follow-ups to be conducted at home, further reducing hospital stay durations.

3. Regional Disparities
In India, ALOS varies significantly by region:
In urban centers/metros like Delhi or Mumbai, hospitals maintain ALOS of 3-4 days due to advanced care protocols.
Rural hospitals might see ALOS exceeding 5+ days due to late patient arrivals and limited post-discharge care facilities.
4. Payer Dynamics
ALOS is often influenced by the payor mix:
Walkins and Insurance push for shorter ALOS to manage costs, creating pressure on hospitals to optimize operations.
Government programs like Ayushman Bharat often result in longer ALOS due to the nature of the patient demographic (older, poorer, and often with advanced illnesses).
Strategies to Optimize ALOS
1. Invest in Pre-Admission Care: Streamlining pre-admission diagnostics ensures patients are admitted only when necessary, reducing unnecessary days. By educating patients about disease management and promoting early intervention, hospitals reduce complications that lead to longer stays.
2. Implement Clinical Pathways: Evidence-based protocols standardize treatment plans, reducing variability in care and ensuring timely discharges. Standardized treatment protocols for common conditions (e.g., pneumonia, heart attacks) reduce variability in care, leading to predictable and often shorter stays.
3. Embrace Technology: Electronic health records (EHRs) can predict optimal discharge dates based on patient progress, while remote monitoring post-discharge ensures continuity of care.
4. Focus on Post-Discharge Support: Strong home healthcare and follow-up systems prevent complications and readmissions, supporting shorter ALOS without compromising outcomes.
5. Enhanced Discharge Planning:
Proactive planning ensures patients are discharged as soon as they are medically stable. Hospitals use tools like checklists and coordination software to streamline this process.
Case in Point — Narayana Hrudayalaya
Narayana Health (NH), founded by Dr. Devi Shetty in 2000, is a benchmark for delivering high-quality, affordable healthcare at scale. Known as the "Wal-Mart of Healthcare," NH’s innovative approach to cost management, operational efficiency, and patient care has made it a fascinating case study for hospitals globally. Dr. Devi Shetty, a cardiac surgeon, founded NH to address India’s critical need for affordable, accessible healthcare. With India’s burgeoning population and lack of adequate medical infrastructure, Dr. Shetty envisioned a model that could treat millions without compromising on quality.
A solution that works only for the rich or only for the poor is not sustainable. Healthcare must work for everyone, and that’s what we aim to do — Dr. Devi Shetty
Key Goals:
Affordability: Reduce costs to serve India's middle and lower-income populations.
Accessibility: Expand the reach of specialized medical care across geographies.
Scalability: Create a replicable model for efficient hospital operations.
1. Economies of Scale
High Volume of Procedures: Narayana Hrudayalaya performs a large number of surgeries daily, particularly cardiac procedures. The hospital performs around 40 heart surgeries per day, allowing it to spread fixed costs over a larger patient base, which helps reduce the average cost per surgery significantly.
Bulk Purchasing: The hospital's centralized procurement strategy enables it to buy medical supplies and equipment in bulk, resulting in lower prices and better negotiation power with suppliers.
Rapid Turnaround: The production line approach allows for quick transitions between surgeries, with surgeons moving from one procedure to the next with minimal downtime. This rapid turnaround increases the number of patients treated daily.

2. Cost Management Practices
Profit and Loss Statements: Surgeons receive daily profit and loss statements detailing the costs and revenues associated with their procedures. This transparency fosters a culture of cost consciousness and accountability, encouraging teams to identify areas for cost optimization.
Cross-Subsidization: Narayana Health employs a cross-subsidization model where wealthier patients or medical tourists pay higher prices, allowing the hospital to offer lower rates to less affluent patients without compromising overall profitability.

3. Technology Integration
Telemedicine Network: Narayana has established one of the world’s largest telemedicine networks, connecting over 800 centers globally. This approach increases access to care without necessitating significant investments in physical infrastructure.
Data Utilization: The use of centralized data systems allows for real-time performance monitoring and efficient administrative processes. Key performance indicators are tracked daily, enabling quick identification and resolution of operational issues.
Deployment of Athma in Emergency Department has reduced the ALOS by 50% in the emergency room by digitizing all the time-consuming documentation process.


4. Standardization of Procedures
Assembly Line Approach: Narayana employs a production line model for surgeries where specialized teams handle specific tasks (e.g., pre-operative assessments, surgical procedures, post-operative care). The production line approach standardizes surgical processes, allowing for predictable and repeatable workflows. This specialization increases efficiency and reduces the time required for each procedure.
Task-Shifting: By delegating specific tasks to trained staff members (such as preoperative assessments and patient education), surgeons can focus exclusively on surgical procedures. This specialization maximizes the use of each team member's skills and reduces the time spent on non-surgical tasks.
Beds are turned over faster due to optimized Average Length of Stay (ALOS). For example, NH’s cardiac patients typically have an ALOS of less than 5 days compared to the industry average of 7–9 days.

5. Performance Measurement
Efficiency Metrics: Surgeons’ performance is closely monitored through metrics such as time taken per surgery, number of stitches used, and blood transfusions required. By focusing on these efficiency metrics, the hospital can identify areas for improvement and optimize surgical practices.
Quality Outcomes: Despite low costs, Narayana maintains high-quality care standards, with a mortality rate within 30 days of cardiac surgery at just 1.4%, compared to the U.S. average of 1.9%.

The Future of ALOS in India
With rising healthcare costs and increasing competition, Indian hospitals are under pressure to manage ALOS effectively. Some trends to watch:
Integration of Home Healthcare: Companies like Shalby and Apollo HomeCare are driving post-discharge support, enabling hospitals to shorten ALOS.
AI and Predictive Analytics: Hospitals are beginning to adopt AI tools to forecast patient discharge timelines accurately.
Integrated Care Models: Collaboration between hospitals, primary care providers, and rehabilitation centers is helping to reduce ALoS while ensuring patients receive adequate follow-up care.
Ayushman Bharat's Influence: As government schemes expand, hospitals must balance higher patient volumes with efficient ALOS management.
Balancing Efficiency and Care
ALOS is not just a metric; it’s a reflection of a hospital’s operational maturity and strategic focus. While reducing ALOS is crucial for profitability, the challenge lies in maintaining care quality and patient satisfaction. Indian hospitals that master this balance will not only thrive in an increasingly competitive market but also set benchmarks for healthcare efficiency globally. In our next part we will explore the insights into Payor mix, Bed capacity & Occupancy.
ARPOB and ALOS are more than financial metrics—they are windows into the operational heartbeat of a hospital. Balancing high ARPOB with an optimal ALOS is key to ensuring both financial sustainability and quality patient care. As hospitals strive to improve these KPIs, they also set the stage for stronger competitiveness in an evolving landscape.
But ARPOB and ALOS are just part of the bigger picture. In the next part of this series, Understanding the Hospital Sector (Part 6): KPIs – Payor Mix, Bed Capacity & Occupancy, we’ll explore how these additional metrics influence profitability and scalability. From analyzing patient demographics to optimizing resource utilization, we’ll uncover the strategies that drive sustainable growth in the hospital sector.
Thanks for the detailed breakdown.. most stuff I have seen is just surface knowledge.. looking forward to more posts